A high-velocity traffic arbitrage team was running seven ad platforms and four revenue partners through spreadsheets and morning hand reports. I built them a central nervous system. One platform that ingests every signal, surfaces decisions worth looking at, and runs the operational glue across the whole business.
Before
The team ran traffic arbitrage at scale. Buying clicks across seven ad platforms (major social, search, native networks), routing them through content properties, monetising via several feed partners. To know whether the spread was profitable, they had to:
- log into each platform separately and export data
- match spend to revenue reports in spreadsheets
- calculate ROI by hand, hunt anomalies, decide what to scale or pause
- repeat every morning, for hundreds of active campaigns
After
One nervous system for the whole operation. All platforms. All revenue partners. The morning report that used to take hours now loads in seconds, and the AI surfaces a couple of useful questions before anyone has to ask one.
AI grounded in real data
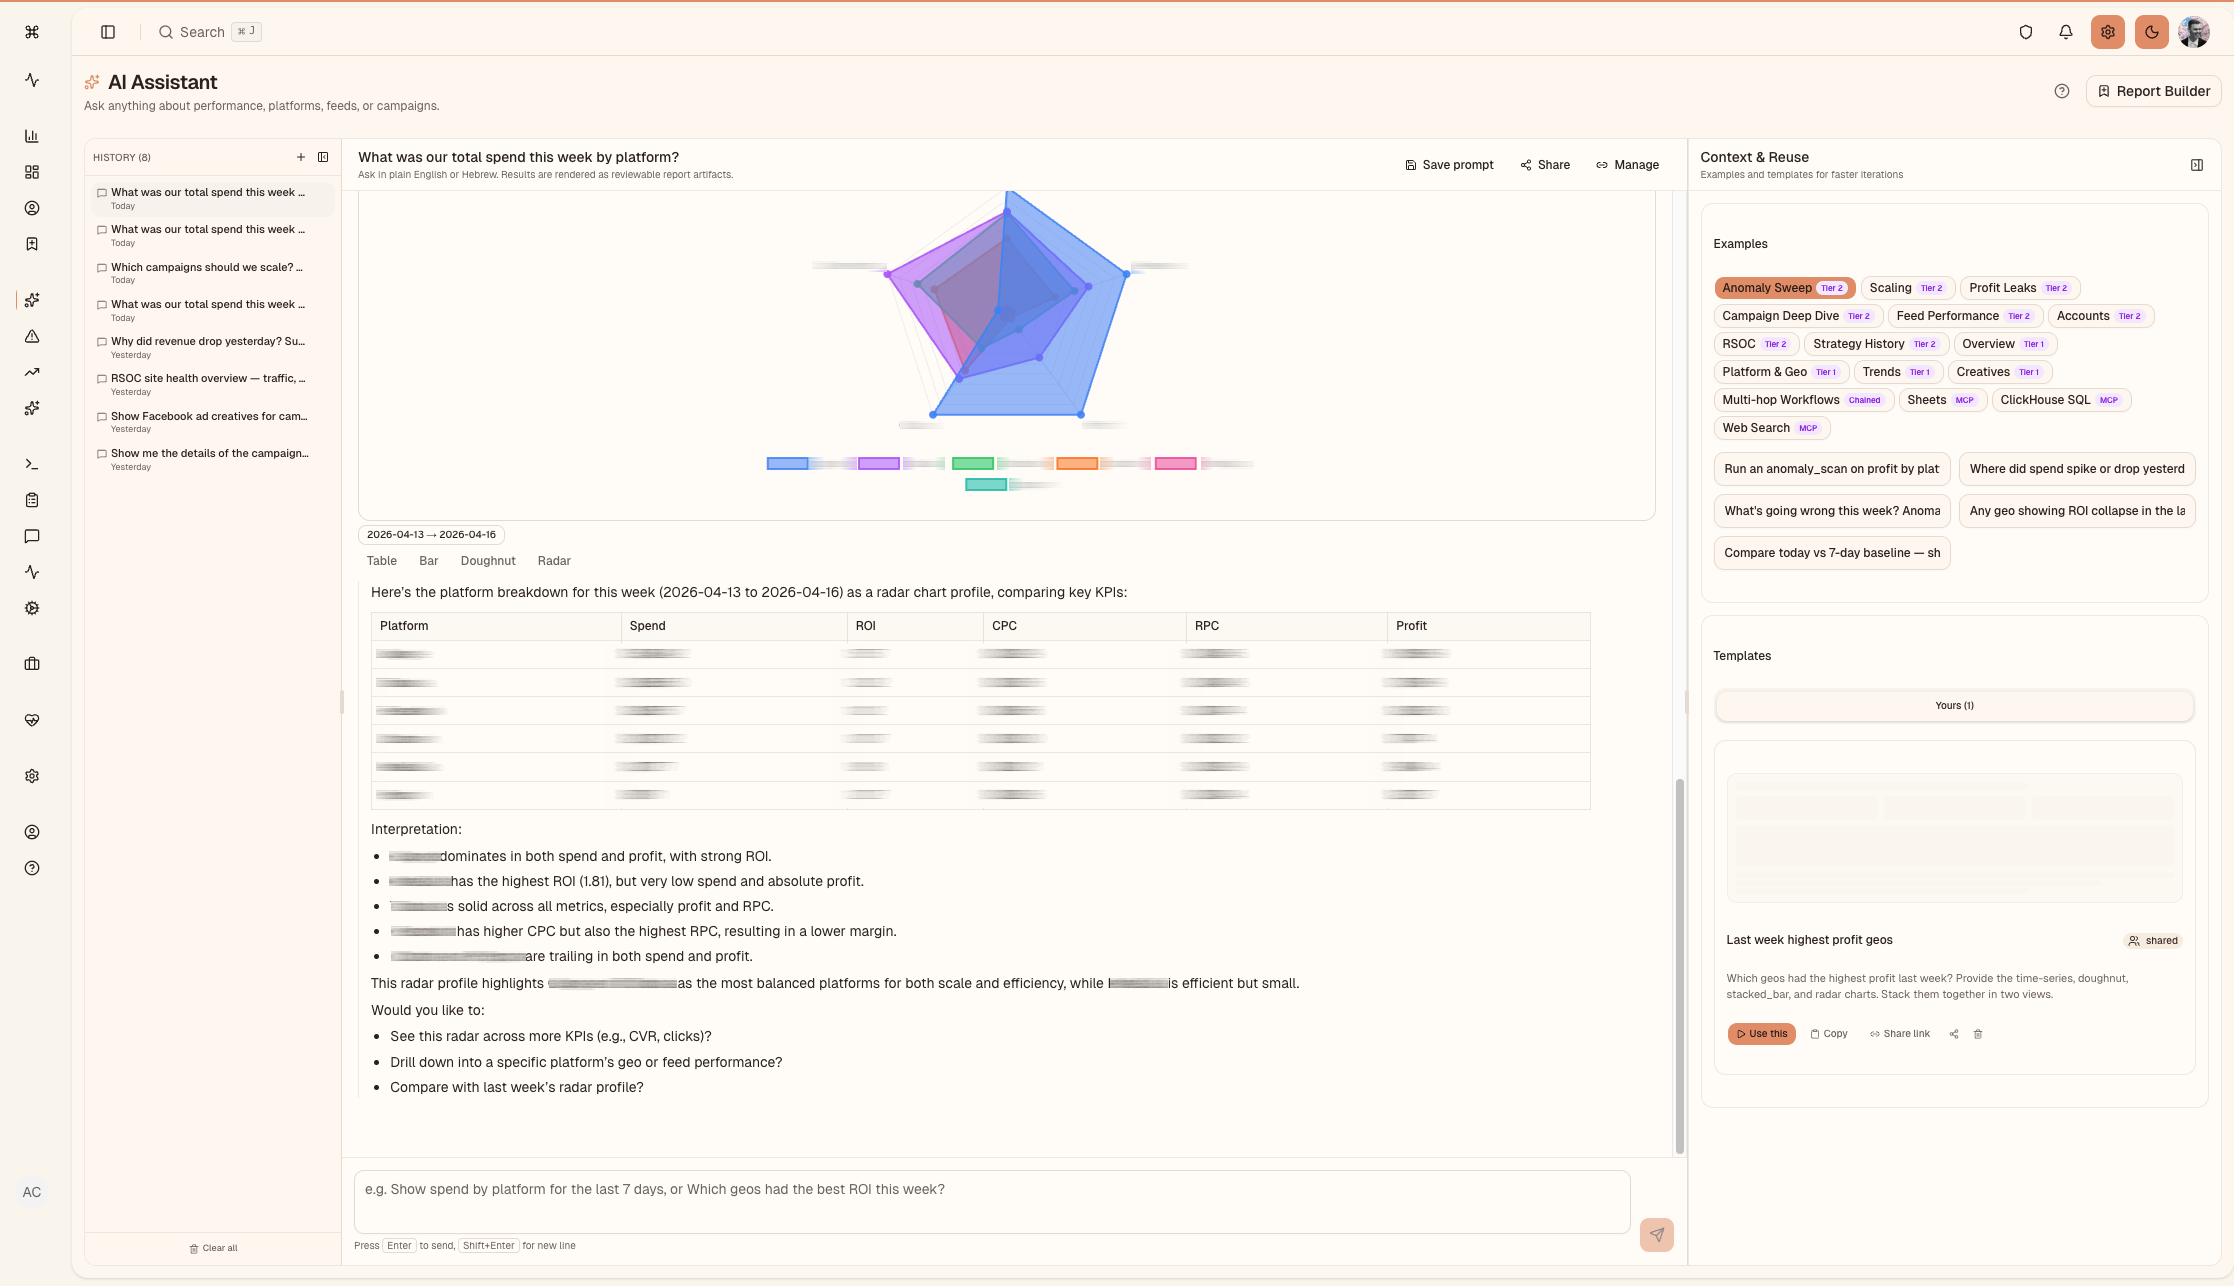
The assistant is not a chatbot pretending to know things. It has direct access to the data warehouse through 16 specialised tools. When a media buyer asks "Why did ROI drop on platform X yesterday?", the model:
- Pulls the campaign-level P&L breakdown
- Checks for strategy changes (bid and budget moves)
- Examines feed revenue for anomalies
- Synthesises a root-cause analysis with specific numbers
Every number in the answer comes from a database query. None of them are guesses.
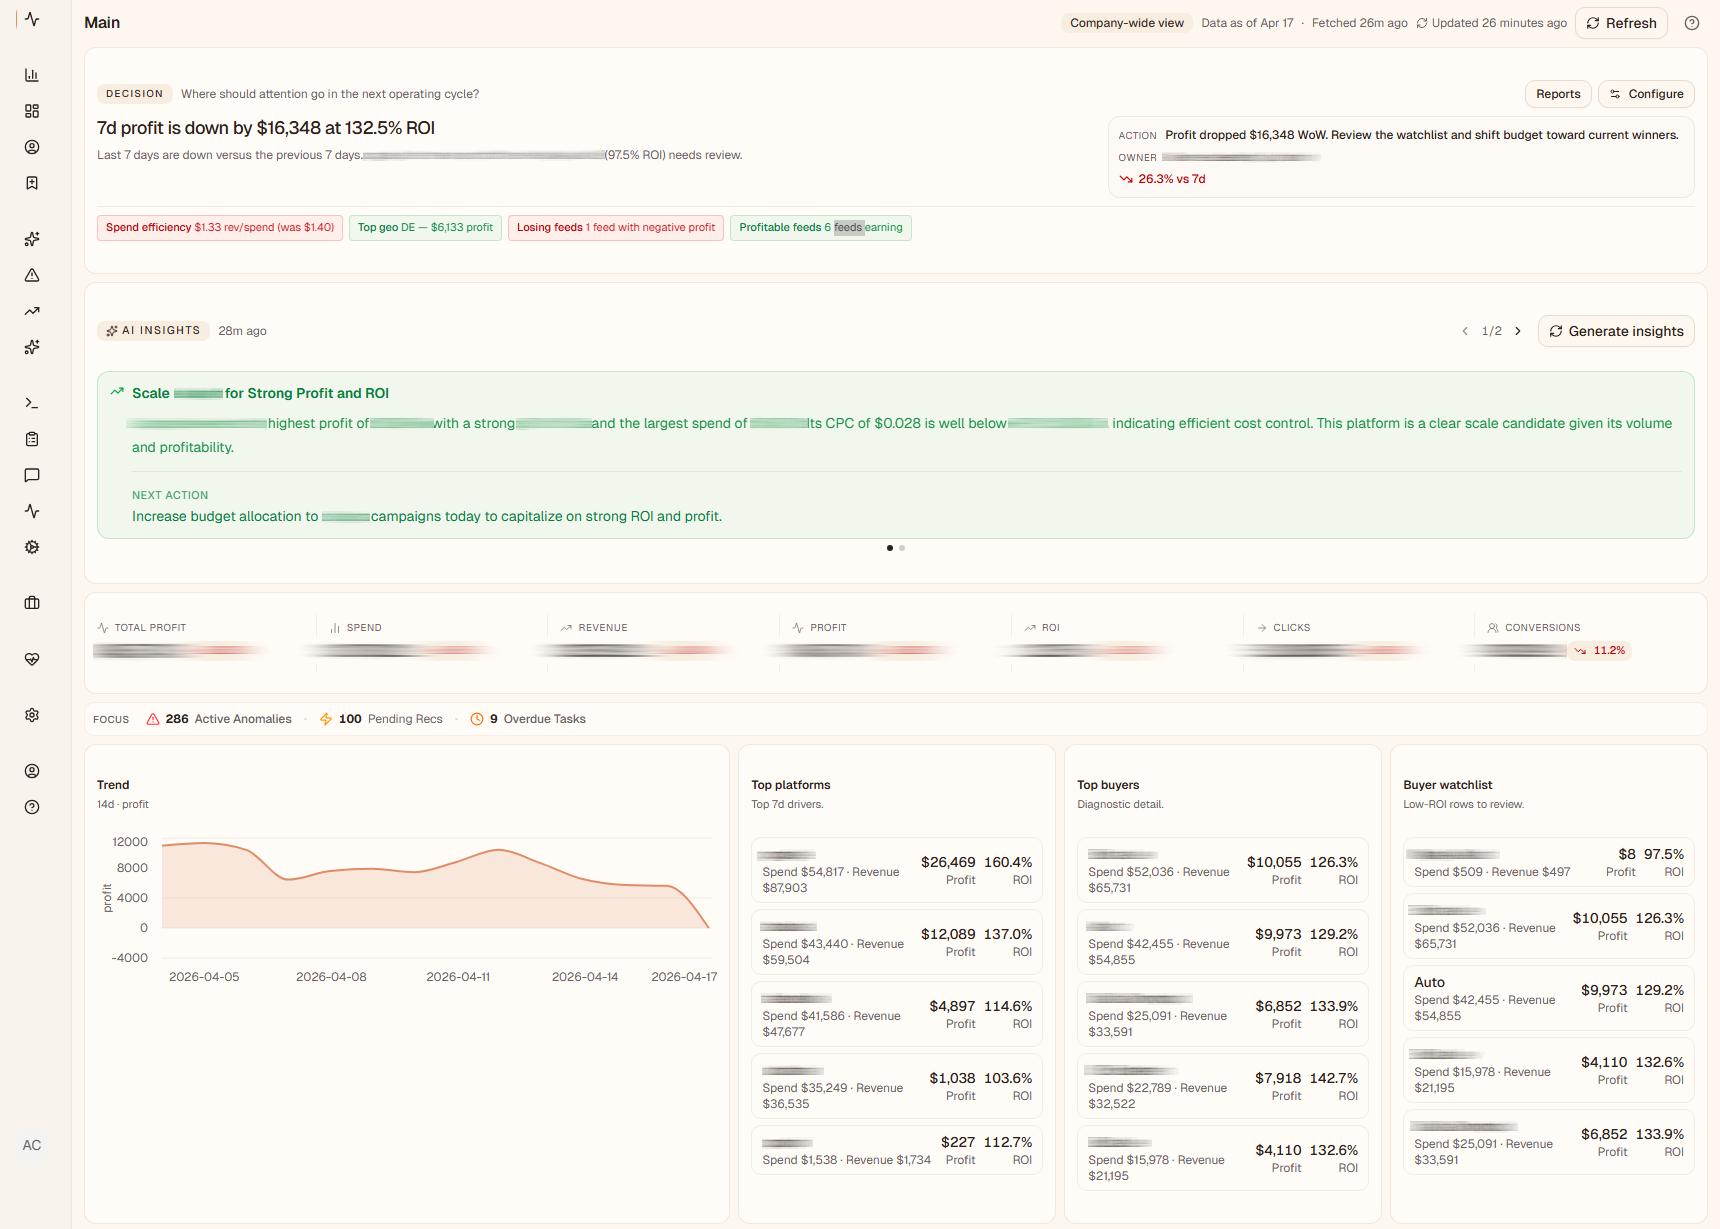
Decisions, not just charts
The platform does more than show data. It surfaces decisions:
- Scaling candidates: profitable campaigns with room to grow
- Profit leaks: campaigns losing money, ranked by loss size
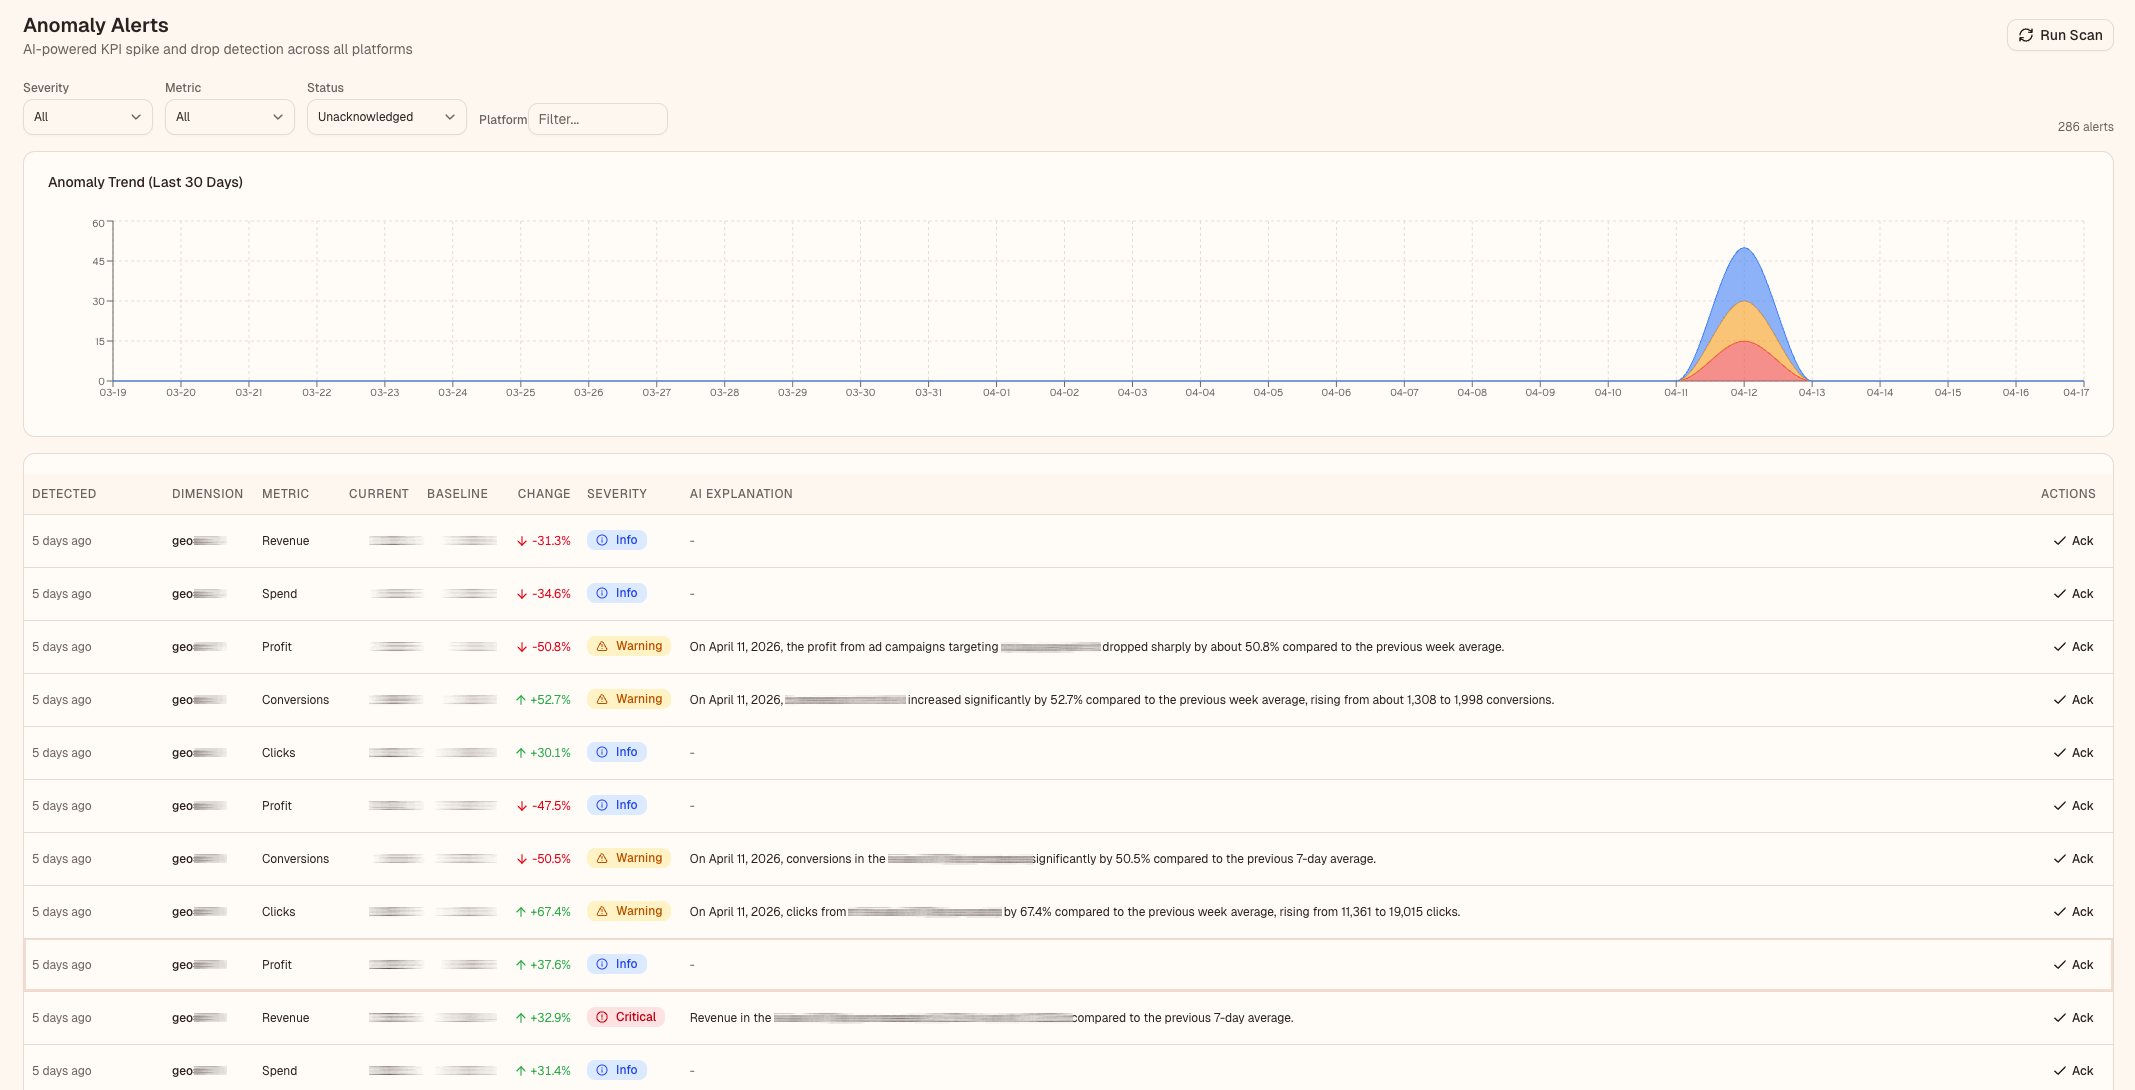
- Anomaly alerts: statistical outliers flagged before anyone notices
- AI insights: generated narratives with a recommended next move
Execution, not just analysis
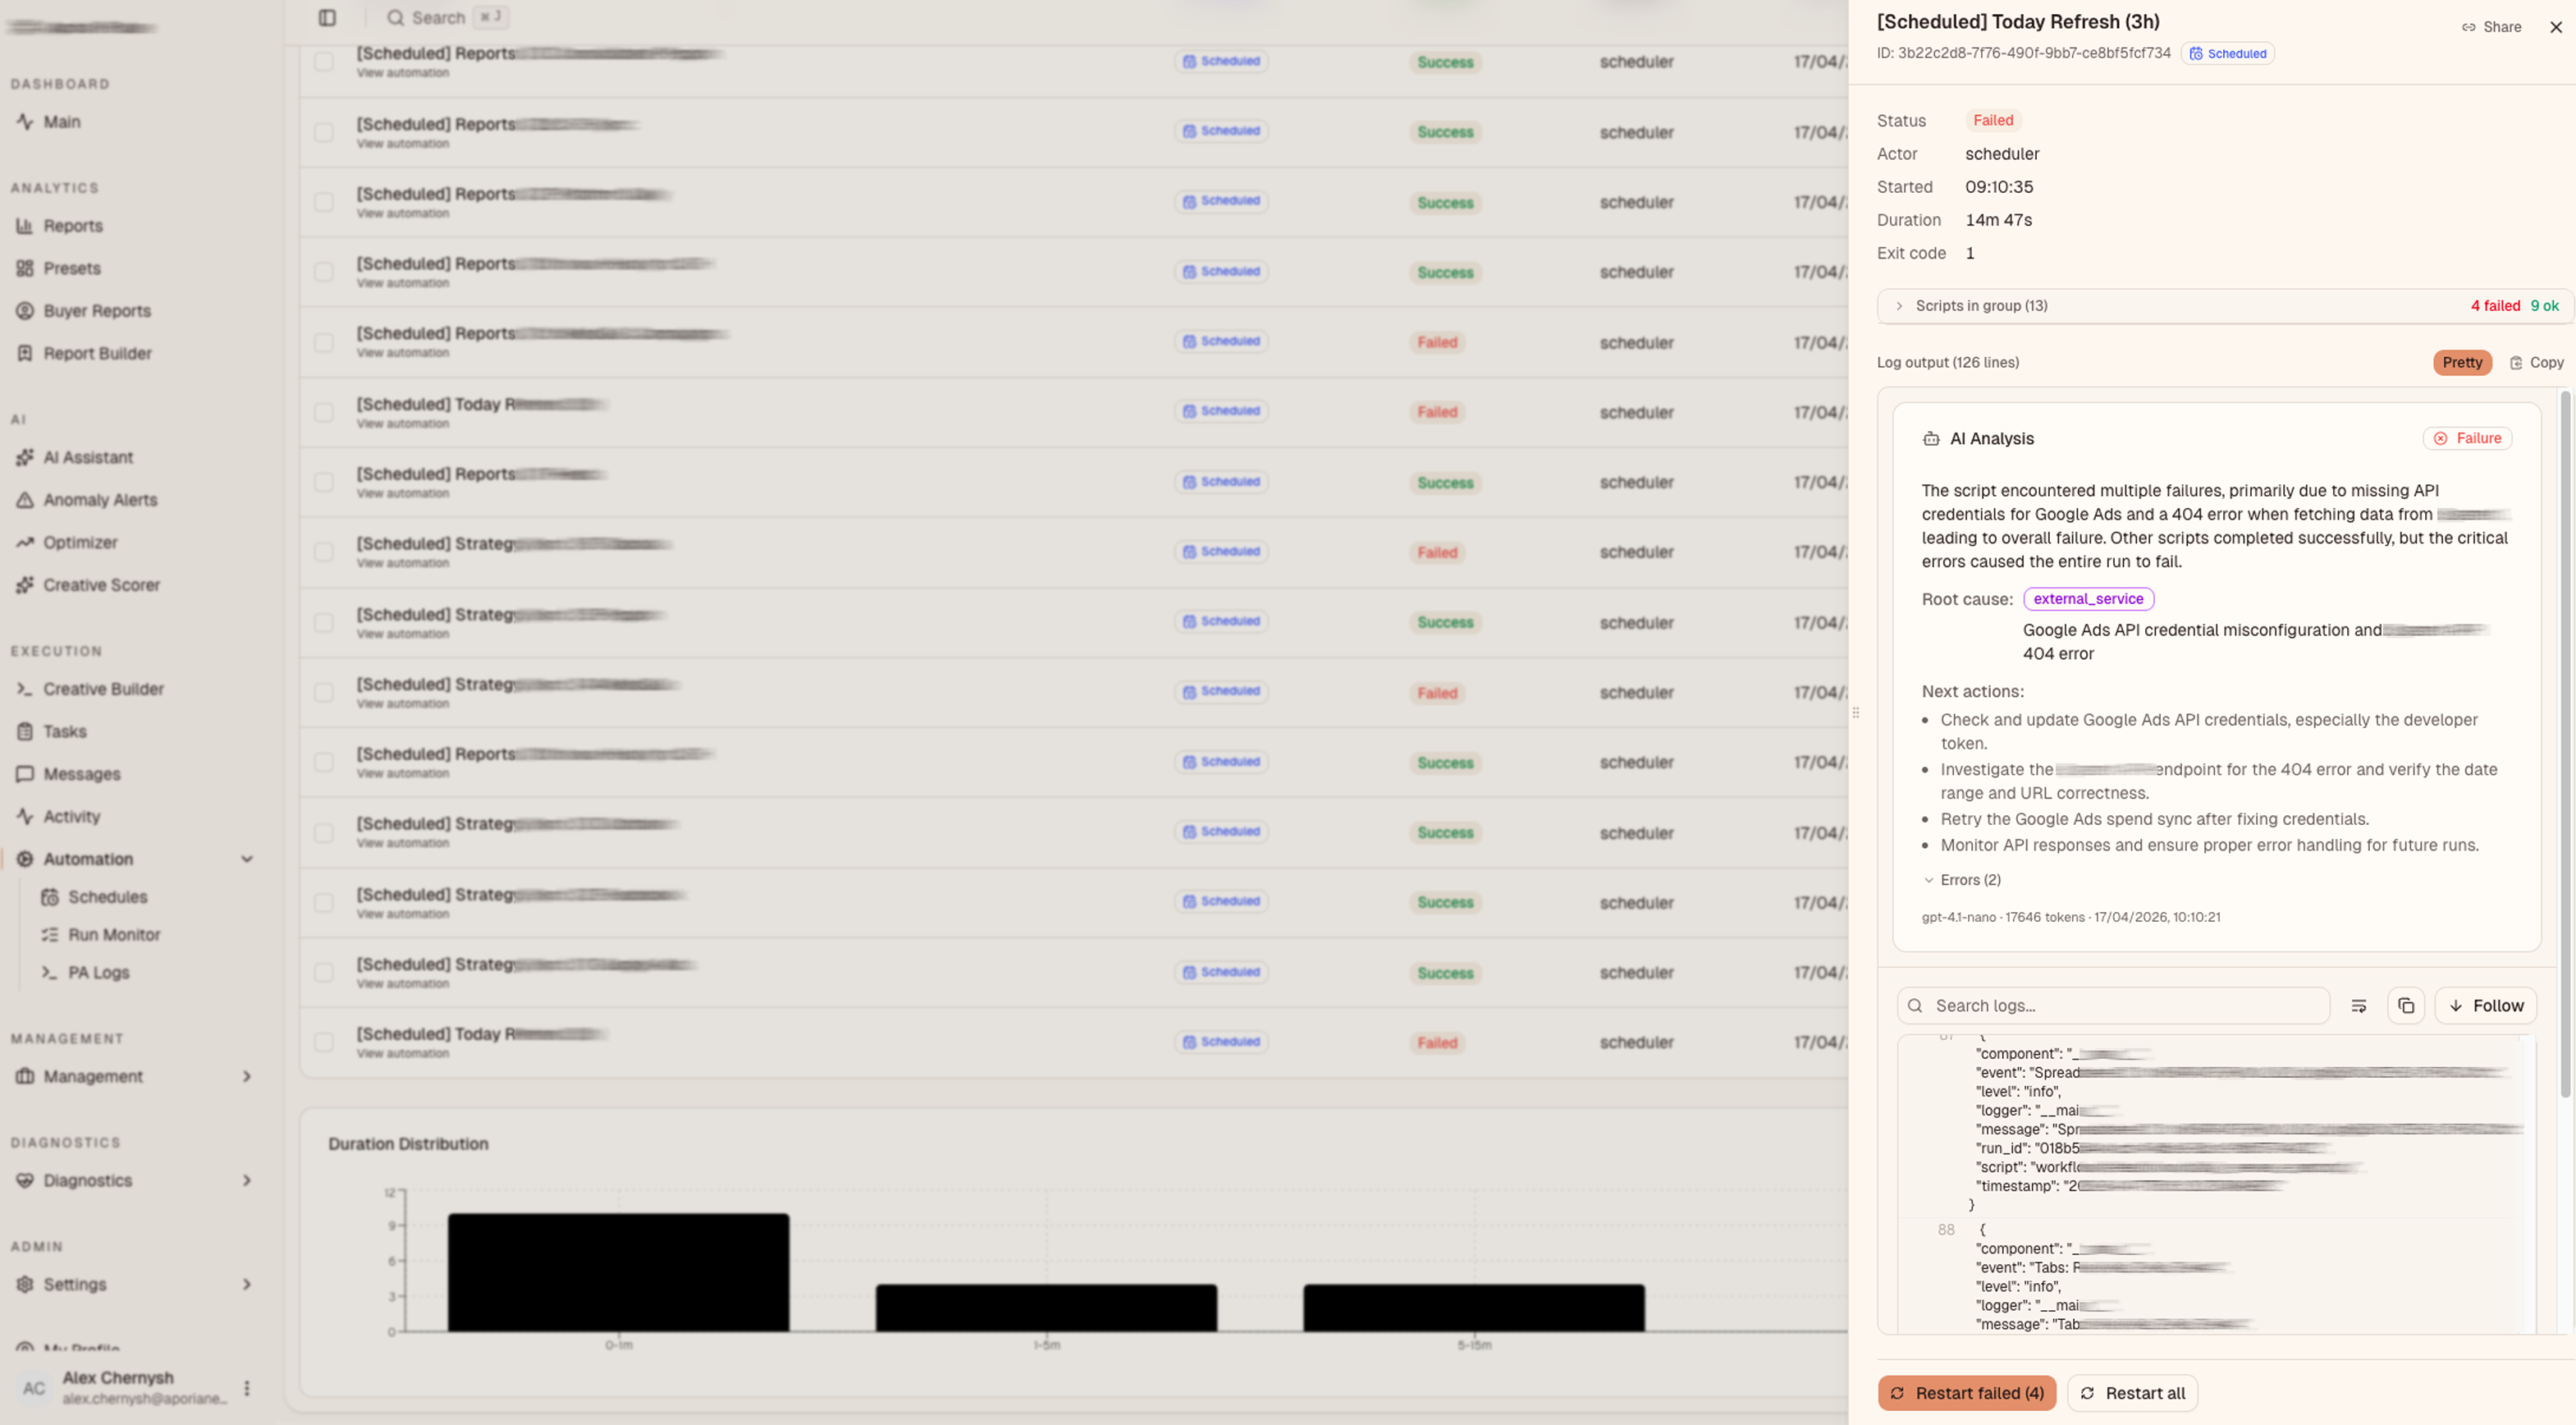
42 scheduled jobs handle platform syncs, data consolidation, and report generation. They are monitored with AI failure analysis that diagnoses the root cause for each job that breaks. A built-in task tracker, creative scorer, and site health monitor sit alongside.
The depth of the build
This was not a dashboard bolted onto an API. Every layer was designed and built from scratch, including the small details that separate a tool people tolerate from one they actually open before coffee.
Product surface
- Kanban task tracker with drag-and-drop, priority levels, classification tags (optimisation, daily reports, features), platform tagging, full status workflows. Wired into the operational context so engineering work connects to business outcomes
- Threaded comments and reactions on tasks. Media buyers and engineers stay in-context, instead of in a Slack thread that disappears by next week
- Four-level notification system: in-app notification centre, browser push, email digests, and Microsoft Teams integration for critical alerts (job failures, anomaly spikes, budget overruns)
- In-platform messaging between team members with read receipts
- ChatGPT-style link sharing for AI conversations. Share a thread URL with a colleague and they see the full analysis, tool calls included, no login required
- AI insight chips embedded throughout the dashboard. KPI cards, anomaly rows, optimiser recommendations, job failure logs. Each chip is a contextual annotation
- Smooth transitions and micro-interactions: skeleton loaders, fade-in animations, tooltip previews on hover, optimistic UI updates, responsive layouts down to mobile
- Draggable widget grid on the main dashboard. Users rearrange KPI cards, breakdown tables, and chart widgets to match how they work
- Onboarding flow for new team members with guided feature discovery
- Role-based access control. Media buyers see their campaigns, managers see everything, admins configure AI settings and MCP servers
Technical depth
57-table ClickHouse data warehouse with materialised views for sub-second queries. 90+ FastAPI endpoints with session auth, caching, and rate limiting. Next.js 16 with React 19, Tailwind 4, shadcn/ui components. Three MCP servers (ClickHouse, Google Sheets, Tavily) for AI tool extensibility. Ansible-managed infrastructure on Hetzner with Cloudflare Tunnel ingress. 1,340+ automated tests. A three-tier AI tool architecture that routes questions to the right data source based on complexity.
Impact
- consolidated 7 platform dashboards into one
- daily reporting time fell from hours to seconds
- AI-powered anomaly detection catches issues before they compound
- automated creative generation pipeline
- the CNS became the team's primary daily operating tool. Every decision routes through it now